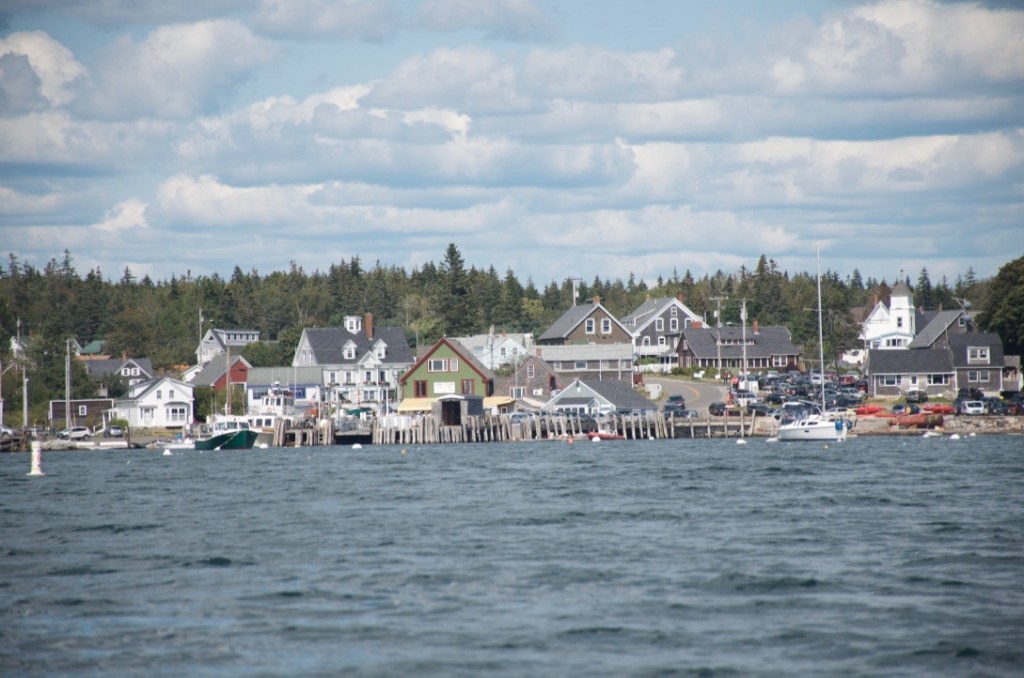
Zillow is out with an analysis today that reports that in places where vacation homes are most common, the housing crisis still shows a noticeable effect on the market.
Scattered across the country, vacation home markets experienced a steeper run up in home values during the housing bubble, but also a sharper fall. Vacation home markets gained 117% in value between 2000 and 2006, compared with an 83% home value increase in places with the smallest share of vacation homes. However, the losses were greater when the housing market crashed, with home values falling 35% and 26%, respectively.
Along the eastern shore of Hilton Head Island, where 54% of homes are vacation homes, the typical home gained 95% in value between 2000 and 2006, then lost 41%. In comparison, Beaufort County overall gained 67% in value, but only fell 36%.
In Cape Cod, where 39% of homes are vacation homes, the typical home gained 83% in value between 2000 and 2006, then lost 19%. The state of Massachusetts as a whole only gained 56% in value, but also fell 19%.
The recovery has also been slower to reach vacation home markets. Since 2010, home value appreciation in these markets has been slower than the rest of the market every year except 2012. Home values grew 0.7 percentage points less in vacation markets in 2017 than they did in the rest of the country.
As a result of this slower home value growth during the recovery, home values in vacation home markets are still 9% below the peak reached at the height of the housing bubble. By contrast, markets with the smallest share of vacation homes are 14% more valuable than they were before the recession.
“Vacation home markets have lagged the rest of the country during the economic recovery, despite an exaggerated boom and bust a decade ago,” said Zillow® senior economist Aaron Terrazas. “As the economy improves and more Americans feel secure in their personal finances and primary residences, it is possible that more will look to buy a vacation home. The good news is that there are still bargains to be found in many vacation communities, but recent tax changes will eat into the tax benefits of second-home ownership. Beyond financial considerations, Americans are increasingly conscious of the environmental risks common in many vacation communities, including those from rising sea levels and storm surges, hurricanes and wildfires.”
The Southern and Western regions have the biggest gap between the recovery in vacation markets and the overall housing market. Home values in Southern vacation home markets are still 17% below the highest point they reached during the housing bubble, while markets with the smallest share of vacation homes are 9% more valuable. In the West, places with the lowest concentration of vacation homes are 21% higher than they were during the housing bubble, and vacation home markets are still 3% lower than their bubble peak value.
The Midwest is the only region where vacation home markets have recovered better than areas where vacation homes are less common – home values in vacation markets are 9% higher than the bubble. In places where vacation homes are least common, home values are 2% above their peak levels from the housing bubble.
National | ||||
Current Value – March 2018 | Value Gained 2000-2006 | Value Lost During Crisis | Current Value vs. Bubble Peak Value | |
Highest Share of Vacation Homes | $ 281,100 | 91% | -35% | -9% |
Lowest Share of Vacation Homes | $ 321,000 | 65% | -26% | 14% |
West | ||||
Current Value – March 2018 | Value Gained 2000-2006 | Value Lost During Crisis | Current Value vs. Bubble Peak Value | |
Highest Share of Vacation Homes | $ 387,600 | 102% | -36% | -3% |
Lowest Share of Vacation Homes | $ 549,900 | 91% | -33% | 21% |
Midwest | ||||
Current Value – March 2018 | Value Gained 2000-2006 | Value Lost During Crisis | Current Value vs. Bubble Peak Value | |
Highest Share of Vacation Homes | $ 146,300 | 35% | -18% | 9% |
Lowest Share of Vacation Homes | $ 177,400 | 32% | -25% | 2% |
Northeast | ||||
Current Value – March 2018 | Value Gained 2000-2006 | Value Lost During Crisis | Current Value vs. Bubble Peak Value | |
Highest Share of Vacation Homes | $ 351,900 | 104% | -21% | 0% |
Lowest Share of Vacation Homes | $ 371,500 | 81% | -18% | 11% |
South | ||||
Current Value – March 2018 | Value Gained 2000-2006 | Value Lost During Crisis | Current Value vs. Bubble Peak Value | |
Highest Share of Vacation Homes | $ 258,800 | 120% | -42% | -17% |
Lowest Share of Vacation Homes | $ 206,000 | 58% | -22% | 9% |