
Comparing new-home closings across 2015, 2020, and 2025 highlights how migration patterns, affordability, and regional economic strength have reshaped where housing demand is concentrated. The shifts offer insight into which states are gaining momentum, and which are gradually losing share.
2015: A Market in Recovery
In 2015, the housing market was still rebuilding momentum following the aftermath of the Great Financial Crisis. Builder activity and buyer confidence were improving, but many markets were still in the early stages of recovery.
Texas, Florida, and California led the nation in new-home closings, together accounting for nearly 40% of total U.S. activity. Texas ranked first with more than 87,000 closings, supported by strong job growth and relatively attainable home prices. Florida followed closely as in-migration and demographic growth supported demand across major metros. California rounded out the top three, reflecting its large population base and historically strong housing demand.
North Carolina also began to emerge as a notable growth market, entering the top tier of states as population growth across the Carolinas began to accelerate.
2020: The Pandemic Reshapes Demand
By 2020, the first year of the pandemic introduced a new set of forces shaping the housing market. Remote work, shifting lifestyle preferences, and migration trends accelerated demand across several Sun Belt states.
Texas remained firmly in the top position but expanded its lead significantly, recording nearly 140,000 annual closings and outpacing all other states by a wide margin. Florida also experienced a sharp rise in activity as households relocated in search of warmer climates, lower costs, and more space.
California remained among the top states, but early signs of slowing momentum began to emerge. The state’s share of national closings edged lower as outbound migration trends gained traction and affordability challenges intensified. These pandemic-era shifts laid the groundwork for the ranking changes that would follow later in the decade.
2025: A Re-Shuffling of the Top Three
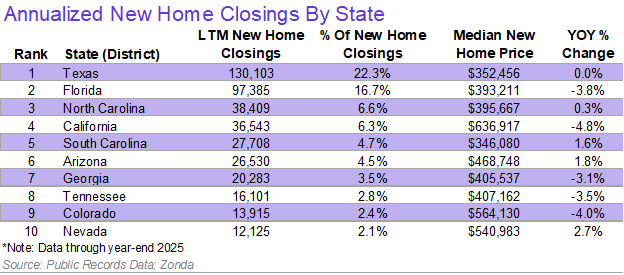
By 2025, the rankings shifted once again. California fell out of the top three for new-home closings, replaced by North Carolina.
The change highlights how population movement is reshaping housing demand. California remains vastly larger, with about 39 million residents, compared with North Carolina’s roughly 11 million. However, the growth trajectories of the two states differ sharply. California has experienced several years of net population outflows, while North Carolina continues to attract new residents due to its affordability, expanding job base, and quality of life.
That growth is increasingly visible in housing demand. North Carolina recorded more than 38,000 new-home closings in 2025, surpassing California’s roughly 36,500 closings and marking a notable reshuffling of the national rankings.
Key Takeaways:
- The largest states continue to shape the industry. Texas and Florida alone accounted for nearly 40% of all new-home closings in 2025. Because of their scale, shifts in these markets have an outsized impact on national housing trends, influencing builder strategy, land acquisition, and construction volumes.
- Affordability pressures remain a defining factor. Home prices have risen substantially across many top states over the past decade, reshaping where buyers can realistically purchase new homes. As prices climb, households increasingly weigh cost of living, home prices, and income growth when deciding where to move.
- Tracking long-term changes reveals where momentum is building. The shift from California to North Carolina in the top three illustrates how quickly market dynamics can evolve. Monitoring these movements over time helps industry professionals identify which regions are expanding, stabilizing, or contracting.
The insights in this article were taken from the National Housing Market Update webinar published in Zonda’s National Outlook.