As of January, there were 17,268 actively selling communities nationally, up 2.4% year over year, but still 9.5% below the same month in 2019. While the national increase reflects modest expansion, market-level results reveal greater variation, with several metros posting double-digit, year-over-year gains.
Top Markets for Community Count Growth
The five fastest-growing markets in January reflect a wide geographic mix, showing that recent community count gains are not concentrated in any single region. This ranking draws from an expanded market list and may differ from findings in Zonda’s New Home Market Update.
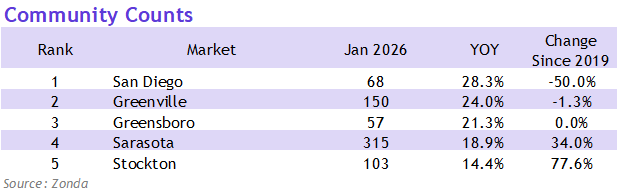
San Diego posted the largest year-over-year gain, with active community counts up 28.3% from January 2025. Note, though, that the growth rate looks large mostly because there are so few actively selling projects in the metro (68). In fact, community counts remain well below pre-pandemic levels, down 50% compared to January 2019.
Greenville, South Carolina, followed with a 24% year-over-year increase to 150 active communities in the first month of 2026, yet remains slightly below 2019 levels, down 1.3%. Greensboro, North Carolina, also posted a sizeable year-over-year increase of 21.3%, however its active community count remains effectively flat relative to January 2019.
Sarasota, Florida, and Stockton, California, rounded out the top five, posting year-over-year gains of 18.9% and 14.4%, respectively. Unlike the top three, both markets have also posted net increases in active community counts relative to 2019.
Across these five markets, community count trends illustrate how near-term changes can differ meaningfully from longer-term positioning. Year-over-year gains capture recent movement, while comparisons to 2019 provide additional context on how current activity aligns with pre-pandemic norms.
The insights in this article were taken from the Zonda Market Ranking published in Zonda’s National Outlook.